Tuesday, October 16, 2012

SharePoint Calculated Columns :: Using calculated columns to write HTML.. by Christophe (Reposted)

Updates
I am now expanding the scope of this method:
- list views (flat views and expanded grouping): this article
- list views (collapsed grouping): this article
- display forms (DispForm.aspx): published on 10/01/2008
- calendar views: published on 11/15/2008
- using calculated columns to write scripts: published on 2/26/2009
- preview panes: not published yet
- filters: not published yet
Also note the troubleshooting section.
Update [09/10/2008]


I have added a few lines to the initial script to address the case of collapsed views. Also, see my note at the end of this post.
Your feedback is important to me. Big thanks to Fernando, Jeff and the others who reported the limitations of the initial version!
A technical note: considering that 1/ the script is generic and 2/ it may still evolve in the future, a good practice is to store it in a separate text file on your site. You can then link to it from any Content Editor Web Part by using the “Content link” box.
I have already introduced calculated columns in a previous post.
One of their limitations is that the output is just text. Sometimes your browser will be smart enough to interpret the text as a hyperlink – when you calculate an e-mail address or a URL for example. Nevertheless in this case the display is usually not user-friendly. This will never allow you to get what a “Hyperlink or Picture” column does, for example.
To extend the possibilities of calculated columns, my idea is to use them to write HTML instead of just text, thus allowing some additional formatting. In this post I am going to show how to achieve this result through a generic method, combining calculated columns and the Content Editor Web Part.
Let’s start with a simple example based on a contacts list (I’ll provide more advanced examples in my next posts). For each team member, I store the first name, last name and job title. On my site home page, I want to display the list of contacts as “First name Last name”, and display the managers’ name in bold. It would look like the first column below:

A calculated column will easily give me the display name:
=CONCATENATE([First Name],” “,[Last Name])
But I have no option in the SharePoint UI to highlight the managers’ name.
So let’s apply my idea, and use calculated columns to write HTML instead of simple text.
The initial formula becomes:
=CONCATENATE(”<DIV>”,[First Name],” “,[Last Name],”</DIV>”)
I can now add my condition: if the job title contains the word “manager”, add bold style. In SharePoint, this translates as:
IF(ISERROR(SEARCH(”manager”,[Job Title],1)),”style=’font-weight:bold;’”,” “)
So here is my complete formula:
=CONCATENATE(”<DIV”,IF(ISERROR(SEARCH(”manager”,[Job Title],1)),” “,” style=’font-weight:bold;’”),”>”,[First Name],” “,[Last Name],”</DIV>”)
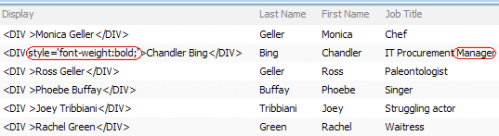
Let’s take a look at our list:

We now have the correct HTML…except that SharePoint is displaying it as simple text. We need to add a short script to change it into HTML.
So let’s add a CEWP to the bottom of our Web Page (how?), and paste the following script in the source editor:
view plaincopy to clipboardprint?

<script type="text/javascript">  

// 

// Text to HTML 

// Feedback and questions: Christophe@PathToSharePoint.com 

// 

var theTDs = document.getElementsByTagName("TD");  

var i=0;  

var TDContent = " ";  

while (i < theTDs.length) {  

try {  

TDContent = theTDs[i].innerText || theTDs[i].textContent;  

if ((TDContent.indexOf("<DIV") == 0) && (TDContent.indexOf("</DIV>") >= 0)) {  

theTDs[i].innerHTML = TDContent;  

}  

}  

catch(err){}  

i=i+1;  

}  

// 

// ExpGroupRenderData overwrites the default SharePoint function 

// This part is needed for collapsed groupings 

// 

function ExpGroupRenderData(htmlToRender, groupName, isLoaded) {  

var tbody=document.getElementById("tbod"+groupName+"_");  

var wrapDiv=document.createElement("DIV");  

wrapDiv.innerHTML="<TABLE><TBODY id=\"tbod"+ groupName+"_\" isLoaded=\""+isLoaded+ "\">"+htmlToRender+"</TBODY></TABLE>";  

var theTBODYTDs = wrapDiv.getElementsByTagName("TD"); var j=0; var TDContent = " ";  

while (j < theTBODYTDs.length) {  

try {  

TDContent = theTBODYTDs[j].innerText || theTBODYTDs[j].textContent;  

if ((TDContent.indexOf("<DIV") == 0) && (TDContent.indexOf("</DIV>") >= 0)) {  

theTBODYTDs[j].innerHTML = TDContent;  

}  

}  

catch(err){}  

j=j+1;  

}  

tbody.parentNode.replaceChild(wrapDiv.firstChild.firstChild,tbody);  

}  

</script> 

<script type="text/javascript">
//
// Text to HTML
// Feedback and questions: Christophe@PathToSharePoint.com
//
var theTDs = document.getElementsByTagName("TD");
var i=0;
var TDContent = " ";
while (i < theTDs.length) {
try {
TDContent = theTDs[i].innerText || theTDs[i].textContent;
if ((TDContent.indexOf("<DIV") == 0) && (TDContent.indexOf("</DIV>") >= 0)) {
theTDs[i].innerHTML = TDContent;
}
}
catch(err){}
i=i+1;
}
//
// ExpGroupRenderData overwrites the default SharePoint function
// This part is needed for collapsed groupings
//
function ExpGroupRenderData(htmlToRender, groupName, isLoaded) {
var tbody=document.getElementById("tbod"+groupName+"_");
var wrapDiv=document.createElement("DIV");
wrapDiv.innerHTML="<TABLE><TBODY id=\"tbod"+ groupName+"_\" isLoaded=\""+isLoaded+ "\">"+htmlToRender+"</TBODY></TABLE>";
var theTBODYTDs = wrapDiv.getElementsByTagName("TD"); var j=0; var TDContent = " ";
while (j < theTBODYTDs.length) {
try {
TDContent = theTBODYTDs[j].innerText || theTBODYTDs[j].textContent;
if ((TDContent.indexOf("<DIV") == 0) && (TDContent.indexOf("</DIV>") >= 0)) {
theTBODYTDs[j].innerHTML = TDContent;
}
}
catch(err){}
j=j+1;
}
tbody.parentNode.replaceChild(wrapDiv.firstChild.firstChild,tbody);
}
</script>


Now the browser displays the strings as HTML, and my list looks like the initial screenshot at the top of the page!
A couple notes:
- The script identifies the to-be HTML by the opening tag <DIV and the closing tag </DIV>.
- I have tested the script in Internet Explorer and Firefox.
- Remember to drop the CEWP after all the views you want to change. You can for example put it at the bottom of the page.
In my next posts, I’ll show various examples involving styles, pictures and links. If you have a specific issue, feel free to submit it!
How about the Data View Web Part?
Of course such customizations could also be done through the DVWP. I am not going to detail this here, feel free to contact me for specific questions.
As I already mentioned, if I can reach the same result with either the CEWP or the DVWP, I’ll favor the CEWP as 1/it is a safer approach 2/the changes can easierly be undone and 3/it doesn’t require SharePoint Designer.
A note for the SharePoint experts
On SharePoint pages, scripts can be called by a function named “_spBodyOnLoadFunctionNames”. This allows for a timely execution of the script, on page load.
In this case, I am not using it, as we want the script to run before the page can be viewed by the users. Are there any side effects of not using _spBodyOnLoadFunctionNames? Advice on this is welcome!
For more examples using this method, see the “Calculated Columns” category.
I would be especially interested in your feedback if you have tested the script in one of the following situations:
- browser other than IE or Firefox on Windows
- non-Windows environment
- scalability (long lists, use across multiple lists)
- specific use cases, with formulas you have written yourself
- coexistence with other code or customizations (DVWP, etc.)
Feel free to leave a comment or contact me: Christophe@PathToSharePoint.com

Wednesday, October 10, 2012

SharePoint Calendar Colourification

One of the ways we use SharePoint is to track events and their status, "Completed", "Pending", or "Rescheduled". It's a pretty common use of SharePoint and depending on how it's put into practice you can simply filter out events that you don't want to see. For example, if you wanted to see only the events that were "Pending" displayed on a calendar, you simply had to filter out events that "do not contain" = "Pending" and presto!


Here's where it gets (got) challenging: The users of this system wanted to display all events, regardless of status, but wanted them colour coded based on their status. Sounds easy enough, but SharePoint doesn't provide a way to do it so I had to figure it out.
After pounding on Google for about an hour and following links to pages that were asking me to pay for a solution that "might" be what I was looking for, I was about to call it quits and tell them that we'll just have to have separate calendars for each status. Then I found that tiny gold nugget I was looking for!
This site described how to include dynamic HTML code into a calculated column. In itself that's not a challenging task, the problem is that SharePoint displays the HTML in the calculated column as text and doesn't execute it as a part of the page. Thankfully, that same page described how to translate displayed HTML into executed HTML using a bit of JavaScript called "innerText" and "innerHTML".


This was a great breakthrough, except that it only applied to the list view, not the calendar view. I decided that it was time to dust off my old dev skills and hack the code up to make it do what I wanted it to do and here's what I came up with.


Calculated Column code: (cleaned up on 14 November 2008)
=CONCATENATE(" <nobr title='",[Status],": ",[Short Description],"' style='font-weight:lighter;color:",IF(ISERROR(SEARCH("Completed",Status,1)),(IF(ISERROR(SEARCH("Pending",Status,1)),(IF(ISERROR(SEARCH("Rescheduled",Status,1)),,"blue")),"red")),"green"),"'> #",[Title],"</nobr><tag>")
Yes, I know it looks like a lot of garble-dy-gook and I'm sorry for that.


Everything you see that is between the square brackets is a column from my list that I want to use in building the HTML. You'll need to change these to match your list.
The most confusing part of this is easily the "IF(ISERROR(..." block. I'll try to clear that up here using standard code formatting instead of the single line of text. The core functionality revolves around this line:

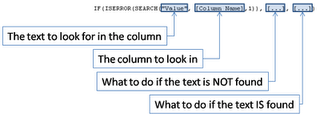
IF(ISERROR(SEARCH("variable", [Column],1)), false, true)

The "variable" - the value you're trying to find. [Column] - the column that you're looking in. false - what to do if the "variable" isn't found in the [Column]. This can be an output string or more code. true - what to do if the "variable" is found.
If you're like me, you may need a bit of a visual clue to help understand this:


SharePoint makes you put it all in one line like Excel. It basically creates the HTML that needs to get translated from displayed code to executed code.
This part is where the magic happens. The original JavaScript code was designed to work on the List view in SharePoint, but I needed it to work on the Calendar view. Here's the code I used: (updated 14 November 2008)
<script type="text/javascript">
var theTags = document.getElementsByTagName("A");
var i=0;
while (i < theTags.length)
{
try
{
TagContent = theTags[i].innerText || theTags[i].textContent;
if (TagContent.indexOf("<tag>") >= 0)
{
theTags[i].innerHTML = TagContent;
}
}
catch(err){}
i=i+1;
}
</script>
This bit of JavaScript is placed into a Content Editor Web Part and placed below the Calendar.
Freely I have received this code, and freely I give it away. If you'd like help hacking this up to make it work on your SharePoint site just drop me an email and I'll help where I can.

Thursday, September 27, 2012

A progress bar for your tasks list and Printing

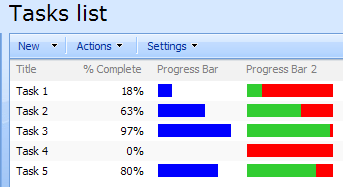
Today, let’s see how to show the progress of your tasks in SharePoint:

We’ll rely on this method: using calculated columns to write HTML. Easy, and entirely done through the SharePoint UI.
The [% Complete] is a default column in tasks lists. We just need to add - in a calculated column - the formulas for this specific use case. Here they are:
- Progress Bar:
=”<DIV style=’background-color:blue; width:”&([% Complete]*100)&”%;’> </DIV>”
- Progress Bar 2:
=”<DIV style=’background-color:red;’><DIV style=’background-color:LimeGreen; width:”&([% Complete]*100)&”%;’> </DIV></DIV>”
Note: the   character is mandatory to make this work in Firefox.
If you are looking for other colours, here is a very good reference:
http://www.w3schools.com/html/html_colornames.asp


Printable progress bars

You may have noticed that when you print lists including my examples of progress bars, the colours are not rendered. This is actually the expected behaviour: when printing Web pages, background colours are usually ignored by the browser.
So what can you do if you want to print your progress bars?
A first possibility is to modify your browser settings to print backgrounds. In Internet Explorer for example, follow this path:
Tools | Internet Options | Advanced | Printing.
A second option is to modify the formula and use colors instead of background colors, or use images. Here is an example of workaround for the above screenshot, where I used border colors (instead of background colors in the original post):
view plaincopy to clipboardprint?

="<DIV style='position:relative;'><DIV style='font-size:0px; border-top: 14px solid "&CHOOSE(INT([%]*10) +1,"red","red","OrangeRed","OrangeRed","DarkOrange","Orange","Gold","yellow","GreenYellow","LawnGreen","Lime")&"; width:"&([%]*100)&"%;'> </DIV><DIV style='position:absolute; top:0px;'>"&TEXT([%],"0%")&"</DIV></DIV>" 

="<DIV style='position:relative;'><DIV style='font-size:0px; border-top: 14px solid "&CHOOSE(INT([%]*10) +1,"red","red","OrangeRed","OrangeRed","DarkOrange","Orange","Gold","yellow","GreenYellow","LawnGreen","Lime")&"; width:"&([%]*100)&"%;'> </DIV><DIV style='position:absolute; top:0px;'>"&TEXT([%],"0%")&"</DIV></DIV>"
As usual, feel free to share your own solutions!
This behaviour was first reported to me by Peter Allen

Tuesday, September 4, 2012

SharePoint Calculated Columns :: Complex String Field Calculations


This formula uses some xfields generated with the Workflow engine. Beware of Content approval and workflow as the new xfields will continue to set approval back to Pending.

="Room: "&xRoom&" at "&TEXT([Start Time],"h:mmam/pm")&" for "&TEXT(Length,"#0.00")&"hrs ["&TRIM([Whats Happening])&"] "&IF([Number of Students]>0,"Capacity: "&[Number of Students]&"People. This is a ","")&IF(xRecur="True","Repeating Booking-"," ONEOFF Booking")&" and is "&MID(xApproval,4,10)
=IF(xRoom="@COMMON",[Whats Happening],UPPER(MID(xRoom,1,5))&" | "&LOWER(MID(xWho,11,15))&" | "&UPPER([Booking Status])&" | "&TEXT([Start Time],"h:mmam/pm")&" | "&TEXT(Length,"#0.00")&" hrs | "&TRIM([Whats Happening])&" | "&IF([Number of Students]>0,[Number of Students]&" Pple.","")&IF(xRecur="True","| REPEATS"," | ONEOFF"))

Friday, August 24, 2012

How to Install SharePoint 2013… for the first time…by Todd Klindt (Reposted here)

Hey everyone,

Todd Klindt is like the guru of SharePoint and he is at the leading edge of all this stuff.

If you have a lab or test environment with some VM’s somewhere not doing anything then have a go at doing what Todd recommends in his blog.

Its a really long URL so I shortened it with Bitly but I swear I don’t get anything for sending you Todd’s way he is just a great teacher.

image

http://bit.ly/X2e24j

Wednesday, August 22, 2012

Visualization – calculated color gradients..by Mark Milner

CalcGradientIf you need dynamically generated visualizations for your SharePoint data, have you considered leveraging the power of the Calculated Column? This Tuesday at 1:00pm EST, Mark Miller and I will give you all the keys to master this simple yet powerful technique. At the end of the two hour entry level workshop, you’ll be able to add color coding, KPIs and other effects – like the one described in this post – to your SharePoint lists.


Green/Yellow/Red is a standard color palette for dashboards. You can just use 3 colors to visualize discrete states, for example the status of a project (on track – drifting - late). But if your purpose is to communicate progress, or a measure on a scale, you need a larger color palette. This is for example the case in my screenshot, where the color reflects the level of completion (in %), in a tasks list.

So, how can I do this in SharePoint? Of course, my plan is to use a calculated column that will determine the color, based on the value in the [% Completed] column.

Method 1: nested IFs

This is the most basic approach:
if [% Completed]>90, select green
else if [% Completed]>80, etc.
I am not going to detail it, as we can do much better.

Method 2: CHOOSE function

The CHOOSE function is more elegant than nested IFs, and is a natural choice when dealing with multiple options. You’ll find all the explanations to achieve a color gradient in this post.

Method 3: pure calculation

So, how can we go even further? Well, colors can be identified by their name, but also by theirrgb code, as each color can be generated from a combination of red, green and blue. For example:
red: rgb(255,0,0)
green: rgb(0,255,0)
blue: rgb(0,0,255)
yellow: rgb(255,255,0)
white: rgb(255,255,255)

Using these values, we can “easily” create our red/yellow/green gradient:
rgb(255,0,0) –> rgb(255,255,0) –> rgb(0,255,0)

The following formula, entered in a calculated column, will give you the rgb value for each value of the [% Completed] column:
=”rgb(“&INT(MIN(510-[% Complete]*255*2,255))&”,”&INT(MIN([% Complete]*255*2,255))&”,0)”

To obtain the visual effect as in the screenshot, use the HTML Calculated Column method, with the following formula:

1
="<span style='display:inline-block;position:relative; width:60px; height:14px;border:1px solid;'><span style='display:inline-block;position:relative;background-color:rgb("&INT(MIN(510-[% Complete]*255*2,255))&","&INT(MIN([% Complete]*255*2,255))&",0); width:"&([% Complete]*100)&"%;height:14px;'><span style='position:absolute; top:0px;'> "&TEXT([% Complete],"0%")&"</span></span></span>"

Tuesday, July 10, 2012

SharePoint Calculated Columns :: Start and End Times


My custom CT (content type) is called Process Step. (The parent CT is Issue.) The purpose of the list is to allow loading of a series of steps (the same set for each month) and track the time it takes to complete each step, focusing on those identified as "key steps."
As I said, I added "start time," "end time" and "duration" to my content type. Start time is a date/time field which populates off a WF that uses "set list item" action to drop the date/time corresponding to "modified" which occurs when the item status changes from "not started" to "in progress." The same thing happens when status changes from "in progress" to "completed" - another WF updates "end time" to copy over whatever was the "modified" date/time matching that change.
"Duration" is a calculated column derived from end time minus start time, single line of text type, using this formula:
=TEXT([End time]-[Start time],"h:mm:ss")
The result of the calculation appears in the hours:minutes:seconds format
I want to provide a way to measure the duration against a target duration; therefore, the values I enter for each step as my target duration must also be in the hours:minutes:seconds format- correct?
Assuming that can be created, I then want one more calculated column )"duration comparison") which will compare the actual duration with the target duration. I am fuzzy on how to display this, however... I'm not sure what the best comparison format would be (a difference, a ratio, not sure). So I don't know what type of field to use. I think it will depend on how the target duration field is formatted.
Finally, I will create a view to display only the "key steps" and set up a KPI that lets me see the key steps' duration comparison values.
Is that the info you need?


Ok, starting to make sense now.
Everything sounds good so far...the "Duration" column should be returning a value in the "h:mm:ss" format (which it sounds like it is).
So, to add in a "Target Duration", you can just create a new "Single line of text" column and literally enter in the values in the same "h:mm:ss" format (i.e. 2.5 hrs would be 2:30:00). Do this for each step you want to track. (Q: are there any issues with manually entering in this data?)
For the "Duration Comparison" column, just use a Calculated column with a return type of "Single line of text" and a formula something like:
=IF(TEXT([Actual Duration],"HH:MM:SS")<TEXT([Target Duration],"HH:MM:SS"),TEXT([Target Duration]-[Actual Duration],"HH:MM:SS")&" Under",TEXT([Actual Duration]-[Target Duration],"HH:MM:SS")&" Over")
This formula would be read as: "If the text of the 'Actual Duration' column formatted as a standard 'hh:mm:ss' time format is less than the text of the 'Target Duration' column formatted as a standard 'hh:mm:ss' time format, subtract the 'Actual Duration' column from the 'Target Duration' column formatted as a standard 'hh:mm:ss' time format, followed by the text 'Under'. If not, subtract the 'Target Duration' column from the 'Actual Duration' column formatted as a standard 'hh:mm:ss' time format, followed by the text 'Over'."
This would display (using example data):
Start Time: 9:00:00
End Time: 9:45:00
Actual Duration: 00:45:00
Target Duration: 1:30:00
Duration Comparison: 00:45:00 Under
Getting a bit trickier, you could use an alternate formula of:

=IF(TEXT([Actual Duration],"HH:MM:SS")<TEXT([Target Duration],"HH:MM:SS"),HOUR([Target Duration]-[Actual Duration])&" hrs "&MINUTE([Target Duration]-[Actual Duration])&" min "&SECOND([Target Duration]-[Actual Duration])&" sec Under",HOUR([Actual Duration]-[Target Duration])&" hrs "&MINUTE([Actual Duration]-[Target Duration])&" min "&SECOND([Actual Duration]-[Target Duration])&" sec Over")
This would display it as:
Start Time: 9:00:00
End Time: 9:45:00
Actual Duration: 00:45:00
Target Duration: 1:30:00
Duration Comparison: 0 hrs 45 min 0 sec Under
This one parses out the individual hours/minutes/seconds into a more "textual" display rather than the "hh:mm:ss" style display, but either version would work.
The custom view portion should be pretty straight-forward, but does this help with the rest?